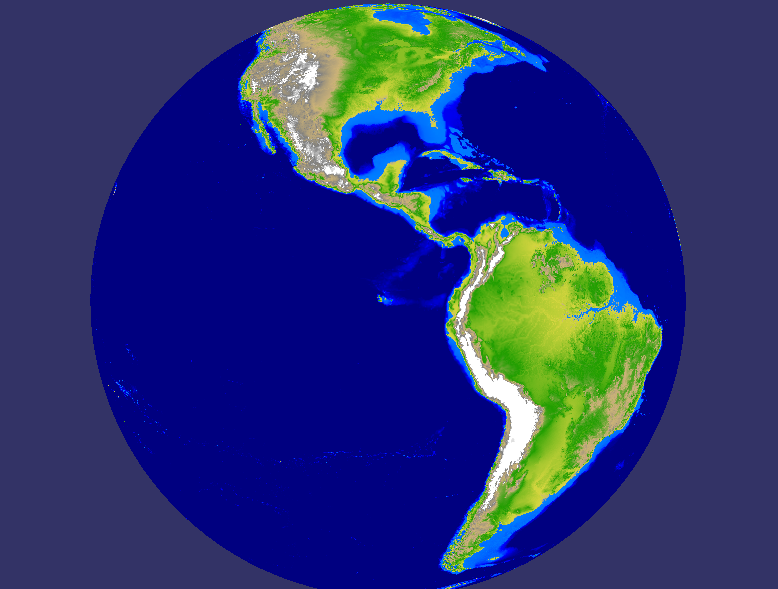
Contour Map
Renders a visual representation of the elevation data in the Map using a color ramp.
ContourMap
CLASS: ContourMapLayer (inherits from: ImageLayer)
| Property | Description | Type | Default |
|---|---|---|---|
| stops | Mapping table of elevation values to colors | "stop" | |
| stop: elevation = height in meters | float | ||
| stop: color = terrain color | HTML color |
Example
<ContourMap>
    <stops>
        <stop elevation="-3000" color="#00002f"/>
        <stop elevation="-2500" color="#00007f"/>
        <stop elevation="-625" color="#0000ff"/>
        <stop elevation="0" color="#007fff"/>
        <stop elevation="3" color="#c2b280"/>
        <stop elevation="160" color="#1f8f00"/>
        <stop elevation="850" color="#bfaf72"/>
        <stop elevation="1875" color="#7f7f7f"/>
        <stop elevation="2500" color="#ffffff"/>
    </stops>
</ContourMap>